- This morning's Grand Rounds on sepsis, by Dr. Subramanian,
- Last week's Grand Rounds on DKA, by Dr. Rose

This blog collects material related to semi-weekly teaching sessions in evidence-based medicine delivered to Internal Medicine residents at Highland Hospital. You can also (usually) find recordings of our weekly Grand Rounds presentations here.
Friday, August 26, 2011
Grand Rounds
As you may or may not have noticed, we have been recording an increasing number of our educational conferences using some state of the art, Scotch-tape-based equipment developed by Dr. Minh Do. Journal club presentations are currently available on the Journal Club blog, and from now on we will be posting Grand Rounds and other notable conferences here. We'll start today with two recent Grand Rounds presentations:
Wednesday, August 17, 2011
The "July Effect" and Relative Risk
 |
| Fig 1. A typical new intern on his first day of wards |
Click here to listen to a recording of Astrid's 5-minute talk on Relative Risk.
Everybody jokes about the spike in mortality which occurs when all the third-year residents leave and the new interns arrive. Does the “July Effect” really exist? Well, the Annals of Internal Medicine just published a systematic review of studies describing trainee changeover on clinical outcomes. The results were heterogeneous but did support the existence of the “July Effect.” Based on a couple of higher quality studies, they estimate that the relative risk increase for mortality (RRI) in the peri-changeover period is between 4.3% and 12.0%.
Everybody jokes about the spike in mortality which occurs when all the third-year residents leave and the new interns arrive. Does the “July Effect” really exist? Well, the Annals of Internal Medicine just published a systematic review of studies describing trainee changeover on clinical outcomes. The results were heterogeneous but did support the existence of the “July Effect.” Based on a couple of higher quality studies, they estimate that the relative risk increase for mortality (RRI) in the peri-changeover period is between 4.3% and 12.0%.
Relative risk (RR, AKA the "risk ratio,") is a way of relating an event to an exposure. The event is the outcome of interest (e.g. disease or death) while the exposure is something we believe is related to the frequency of the event, (e.g a treatment, a vaccination, an environmental factor, or, as in our example, admission in July). The relative risk is simply the ratio of the incidence of the event in the exposed group to the the incidence of the same event in the non-exposed group - anothe rway of saying that is that it's the experimental event rate (EER) divided by the control event rate (CER).
You can easily calculate the relative risk using a table not disimilar to the one used in our last post to calculate sensitivity, specificity and PPV/NPV:
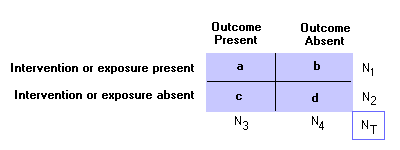
Using this table, RR = [(a / a + b) / (c / c + d)].
This seems pretty simple - but the Annals article reports its findings in terms of relative risk increase. This is different than the relative risk, and refers to the size of the increase in risk relative to the baseline incidence. So if the relative risk is (EER/CER), the relative risk increase is [(EER-CER)/CER].
Please remember, both relative risk and relative risk increase are comparative measures - they tell you nothing about the absolute magnitude of the effect.
Wednesday, August 10, 2011
Hepatic Encephalopathy, PPV and NPV
Last week we talked about sensitivity and specificity, which we calculated using this table:
There are several other useful test characteristics which can be calculated using these numbers, but today we just reviewed positive predictive value and negative predictive value (PPV and NPV). The PPV and NPV are the proportion of positive or negative results which actually mean that the person does or doesn't have the target disorder. This is calculated as PPV = A / (A+B) and NPV = D / (C+D). To put it another way, the PPV/NPV are your post-test probability.
A crucial thing to remember about the PPV/NPV is that, unlike sensitivity and specificity, they are directly proportional to the prevalence of the target disorder. This is handily illustrated by a recent study in the Postgraduate Medical Journal, illustrating the characteristics of clock-drawing as a diagnostic test and grading instrument for hepatic encephalopathy. Their attempt to use this simple bedside test to follow the progression of the disorder made a lot of sense, but in one of their first tables they report that, for the simple diagnosis of hepatic encephalopathy, being unable to draw a pretty perfect clock has a sensitivity of 86%, a specificty of 80%, and a PPV of 96%.
Recall that everyone in the study already had a clinical diagnosis of hepatic encephalopathy. It turns out that clinical diagnsosi is fairly accurate, and when the investigators applied their diagnostic gold standard (a composite of two well-validated neuropsychiatric tests) the actual prevalence of the disorder in the test population was close to 100%. Because the prevalence was so high, any diagnostic test would have a high PPV, regardless of its test characteristics, since the likelihood of a false positive was so low. Imagine you have a breathalyzer that doesn't work very well, and you're looking for drunk people on the Las Vegas strip on New Year's Eve. Even if it only picks up 1 case in 10, it will always be right because everybody's drunk.
So it's worth knowing PPVs and NPVs for individual diagnostic tests, but you also have to know where they came from. If the prevalence in the study population was basically the same as the prevalence in your patient population, then you can probably rely on its accuracy in your patient's case; however, if it was much higher or lower you'll need to adjust it or use a different measure - more on both topics later.
 |
| Table 1: Useful grid for calculating test characteristics. |
A crucial thing to remember about the PPV/NPV is that, unlike sensitivity and specificity, they are directly proportional to the prevalence of the target disorder. This is handily illustrated by a recent study in the Postgraduate Medical Journal, illustrating the characteristics of clock-drawing as a diagnostic test and grading instrument for hepatic encephalopathy. Their attempt to use this simple bedside test to follow the progression of the disorder made a lot of sense, but in one of their first tables they report that, for the simple diagnosis of hepatic encephalopathy, being unable to draw a pretty perfect clock has a sensitivity of 86%, a specificty of 80%, and a PPV of 96%.
 |
| Fig. 1 PPV is directly proportional to prevalence. |
So it's worth knowing PPVs and NPVs for individual diagnostic tests, but you also have to know where they came from. If the prevalence in the study population was basically the same as the prevalence in your patient population, then you can probably rely on its accuracy in your patient's case; however, if it was much higher or lower you'll need to adjust it or use a different measure - more on both topics later.
Wednesday, August 3, 2011
Egophony, Sensitity and Specificity
Click here to listen to Nick's 5-minute talk on Sensitivity and Specificity.
Although we may not think about it very often, physical signs have test characteristics just like laboratory assays do. Some knowledge of the the test characteristics of different physical signs can be useful in practicing rational and cost-effective medicine.
Although we may not think about it very often, physical signs have test characteristics just like laboratory assays do. Some knowledge of the the test characteristics of different physical signs can be useful in practicing rational and cost-effective medicine.
 |
| Consolidated lung with air bronchograms |
This week we talked about the sensitivity and specificity of egophony in the diagnosis of pneumonia. Sensitivity can be defined as “positivity in disease,” and is expressed as the number of patients with a positive test result divided by the total number with the target disorder, giving the percentage of true positives in the diseased population. Specificity can be defined as "negativity in health," and is expressed the number of patients with a negative test result who don’t have the target disorder, giving the percentage of true negatives in the healthy population.
This is a useful and widely reproduced table from which you can always get sensitivity and specificity (among other things):
In our example, reference to the literature (McGee’s Evidence Based Physical Diagnosis,) suggested that the sensitivity of egophony for pneumonia is a paltry 4-16%, whereas the specificity is nearly 100%. So if you’re sure you hear it, you may not even need a chest x-ray to make the diagnosis – but the absence of this sign is basically meaningless.
Subscribe to:
Comments (Atom)